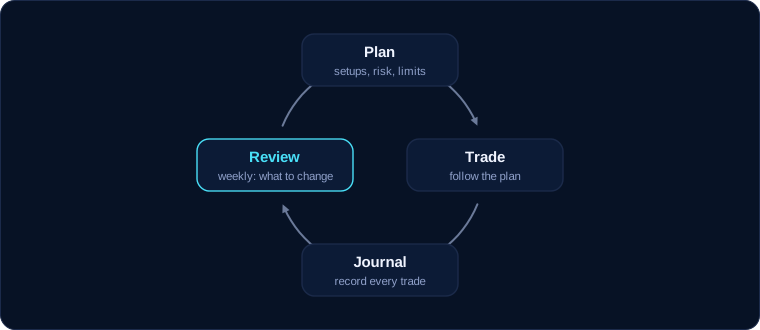
A trading plan is a written set of rules that decides what you trade, when you trade, how you enter and exit, and how much you risk on each trade. A trading journal is the record of every trade you take under that plan, with enough detail to show whether the plan works and whether you actually followed it.
Together they turn trading from a string of one-off decisions into a process you can measure and improve. The plan tells you what to do; the journal shows what you really did and what it produced.
What a trading plan contains
A useful plan is specific enough that someone else could tell whether a given trade followed it. A rule such as "buy when it looks strong" cannot be tested, so write every part in terms you can check with a yes or a no.
Markets and sessions
List the exact instruments you trade, for example EUR/USD and XAU/USD (gold), and the hours you trade them; market hours and trading sessions explains when each market tends to be busiest.
Setups and entry criteria
A setup is a specific situation you trade, such as a pullback to support in an uptrend. For each one, write the timeframe, the conditions that must be present and the exact trigger, for example "enter when a 1-hour candle closes back above support after touching it."
Risk per trade
Risk a fixed percentage of your account on every trade, for example 0.5% or 1%. That amount is called 1R, and it becomes the unit you measure results in. Size each trade from its stop distance so a full loss costs exactly 1R; how to calculate position size from your stop loss shows the method.
Stop and target rules
State where the stop goes, for example a few pips beyond the swing low that defines the setup, and how the target is set, for example the next resistance level with a minimum reward of 2R. Add your management rules: whether you ever move the stop to break-even (your entry price), close part of the position early, or trail the stop behind price.
Daily limits and review routine
Cap the number of trades you take in a day, for example three, and set a personal daily loss limit, for example 2R, after which you stop until the next session. Finally, write down when you review: a short check after each session and a longer review once a week.
A fill-in trading plan template
Copy this list into a document and complete each line in your own words, keeping it short enough to reread before every session.
- Markets I trade: the exact symbols, for example EUR/USD and XAU/USD.
- Sessions and hours: when I trade, in my local time.
- Timeframes: the chart for direction and the chart for entries.
- Setup 1: name, required conditions and entry trigger.
- Setup 2: name, required conditions and entry trigger.
- Risk per trade: a fixed percentage of the account, which equals 1R.
- Stop rule: where the stop goes and why that price proves the idea wrong.
- Target rule: how the target is chosen and the minimum reward in R.
- Trade management: whether and when I move the stop, take partial profits or trail.
- Maximum trades per day: a number I will not exceed.
- Personal daily loss limit: the loss in R after which I stop for the day.
- No-trade conditions: for example tired, unwell or upset.
- Review routine: when I do my session check and my weekly review.
The trading journal: what to record for every trade
A journal only works if you fill it in for every trade, wins and losses alike, right after it closes. A spreadsheet with one row per trade is enough. Record:
- Date and time of entry and exit.
- Instrument, for example EUR/USD.
- Direction: long (buy) or short (sell).
- Setup: which setup from your plan it was.
- Entry, stop and target prices as planned.
- Size in lots or units.
- Risk in R: normally exactly 1R; anything else is a sizing error worth noting.
- Result in R: the profit or loss divided by the amount risked.
- Screenshots of the chart at entry and at exit.
- Emotions and notes: how you felt, and whether you followed the plan.
Recording results in R lets you compare trades and accounts of different sizes. If you risked $100 and made $250, the result is +2.5R; a full loss is −1R. Risk-reward ratio and win rate covers R-multiples in depth.
A sample trading journal
Here is a sample week of five trades with illustrative prices. The account is $10,000 and every trade risks 1%, so 1R = $100. Each planned target is 2R, twice the stop distance.
| Trade | Instrument and setup | Entry / stop / target | Result | Notes |
|---|---|---|---|---|
| 1 | EUR/USD long, pullback to support | 1.0850 / 1.0830 / 1.0890 | +2.0R | Followed plan |
| 2 | XAU/USD short, rejection at resistance | 2,410 / 2,416 / 2,398 | −1.0R | Entered before the candle closed |
| 3 | BTC/USD long, breakout retest | 65,000 / 64,350 / 66,300 | +2.0R | Followed plan |
| 4 | EUR/USD short, failed breakout | 1.0880 / 1.0895 / 1.0850 | −1.0R | Late entry, felt rushed |
| 5 | XAU/USD long, trend pullback | 2,400 / 2,394 / 2,412 | +1.0R | Closed early at 2,406 out of fear |
Sizes differ because the stops differ. On trade 1 the stop is 20 pips (a pip is 0.0001 on EUR/USD) and one pip on a standard lot is worth $10, so the size is $100 ÷ (20 × $10) = 0.5 lots. On trade 2 the stop is $6; if your platform's gold contract is 100 troy ounces per lot, a $1 move is worth $100 per lot, so the size is $100 ÷ (6 × $100) ≈ 0.167 lots, rounded down to 0.16. Gold contract sizes vary, so always check the contract specification on your own platform.
Weekly review questions
Once a week, read through every trade and its screenshots, then answer:
- Did I follow my plan on every trade? If not, which rule did I break, and why?
- Was every loss close to −1R? If not, where did sizing or stop discipline slip?
- Which setup produced the best and the worst results in R?
- Did I move a stop, cut a winner early, chase an entry or go past my daily limits?
- What do my notes on emotions say about the trades where I broke a rule?
- What one change will I focus on next week?
How to calculate win rate, average R and expectancy
Once your results are in R, three numbers summarize your performance. Win rate is winning trades ÷ total trades. Average win and average loss are the mean results in R of your winners and your losers. Expectancy is the average result per trade, in R.
Expectancy = (win rate × average win) − (loss rate × average loss)
Worked through on the sample journal:
- Win rate: 3 winners out of 5 trades = 3 ÷ 5 = 60%, so the loss rate is 40%.
- Average win: (2.0 + 2.0 + 1.0) ÷ 3 ≈ 1.67R.
- Average loss: (1.0 + 1.0) ÷ 2 = 1.0R.
- Expectancy: (0.60 × 1.67) − (0.40 × 1.0) ≈ 1.00 − 0.40 = +0.60R per trade.
As a check, the five results add up to +3R, and 3R ÷ 5 trades = +0.6R.
Five trades say almost nothing, so treat this as arithmetic practice, not evidence. Read the notes too: trade 5 was closed at +1R instead of its planned +2R, and trades 2 and 4 broke entry rules.
Turning lessons into plan changes
Your journal will show two kinds of problems, and they need different fixes.
- Execution problems: you did not follow the plan, as in trades 2, 4 and 5 above. The fix is a habit, such as a pre-trade checklist; see trading psychology.
- Plan problems: you followed the plan exactly over a meaningful number of trades, and a setup still produced poor results in R. That is evidence to adjust the setup or drop it.
When you change the plan, change one thing at a time, note the date and the reason, and judge the change only after a set number of new trades, for example the next 30 trades of that setup. Keep old versions so you do not repeat changes that did not work.
Common mistakes
- A plan that is too vague. Fix: rewrite each rule so a trade either clearly meets it or clearly does not.
- Journaling only some trades. Fix: log every trade, including the ones you are not proud of, right after it closes.
- Tracking money instead of R. Fix: record risk and result in R so trades of different sizes compare fairly.
- Changing the plan after every loss. Fix: change one rule at a time and judge it over a set number of trades.
Key takeaways
- A trading plan sets out your markets, setups, risk, stop and target rules, daily limits and review routine in checkable terms.
- A journal records every trade with entry, stop, target, size and result in R, plus screenshots and notes on emotions.
- Win rate, average win, average loss and expectancy come straight from the journal, but only a large sample makes them meaningful.
- Separate execution problems from plan problems, and change one rule at a time.
Frequently asked questions
What should a trading plan include?
At minimum: your markets and sessions, setups with exact entry criteria, risk per trade, stop and target rules, a maximum number of trades per day, a personal daily loss limit and a review routine, each written so it can be checked with a yes or a no.
How many trades do I need before I judge a strategy?
Enough that one lucky or unlucky streak cannot dominate the result. A practical rule of thumb is at least 30 trades of the same setup, taken under the same rules, before drawing firm conclusions.
What is a good expectancy in trading?
There is no universal target. What you want to see is an expectancy that stays positive after costs over a large sample of trades taken by the rules. A small positive figure over many trades tells you more than a large one over ten.