A moving average is the average closing price over a set number of recent candles, recalculated every time a new candle closes and drawn as a line on the chart. The simple moving average (SMA) gives every candle in that window equal weight, while the exponential moving average (EMA) gives more weight to the latest prices, so it reacts faster.
Moving averages do not predict price. They smooth out the noise of individual candles so you can see the direction and strength of a trend more clearly. That is why they appear on so many charts, on every timeframe.
SMA vs EMA: how each is calculated
The simple moving average (SMA)
The SMA adds up the last N closing prices and divides by N. N is the period: the number of candles in the window. A 20-period SMA on a 1-hour chart averages the last 20 hourly closes; on a daily chart, the last 20 daily closes.
SMA = (sum of the last N closes) ÷ N
When a new candle closes, the oldest close drops out of the window and the newest one comes in. That is what makes the average "move".
Worked example: a 5-period SMA on EUR/USD
Take five daily closes on EUR/USD, for example:
| Day | Close |
|---|---|
| 1 | 1.0850 |
| 2 | 1.0840 |
| 3 | 1.0845 |
| 4 | 1.0835 |
| 5 | 1.0840 |
Add them: 1.0850 + 1.0840 + 1.0845 + 1.0835 + 1.0840 = 5.4210. Divide by 5: 5.4210 ÷ 5 = 1.0842. The 5-period SMA after day 5 is 1.0842.
Now day 6 closes at 1.0900, a sharp move up. Day 1 (1.0850) drops out and day 6 comes in: 5.4210 − 1.0850 + 1.0900 = 5.4260, and 5.4260 ÷ 5 = 1.0852. The SMA rose 10 pips (a pip is 0.0001 on EUR/USD), even though price closed 58 pips above the previous average.
The exponential moving average (EMA)
The EMA uses a multiplier so the latest close counts more than older ones: k = 2 ÷ (N + 1), so for a 5-period EMA, k = 2 ÷ 6 = 0.333. Each new value is EMA = previous EMA + k × (close − previous EMA), and the first value is usually seeded with the SMA.
Start the EMA at the day-5 SMA of 1.0842. Day 6 closes at 1.0900:
- Gap between close and previous EMA: 1.0900 − 1.0842 = 0.0058
- Weighted gap: 0.0058 × 0.333 = 0.0019
- New EMA: 1.0842 + 0.0019 = 1.0861
After the same candle, the EMA moved 19 pips and the SMA only 10. That is the whole trade-off: the EMA responds faster to new information, but a single unusual candle also pulls it around more. The EMA never fully drops old prices; their weight just shrinks with every new candle.
| Feature | SMA | EMA |
|---|---|---|
| Weighting | Equal for every candle | Heavier on recent candles |
| Reaction to new prices | Slower | Faster |
| Often used for | Long-term trend, such as the 200 | Short-term trend and pullbacks, such as the 9 or 20 |
Common periods: 20, 50, 100 and 200
No period is special in itself. The popular ones matter mainly because so many traders watch them, which can make price react around them more often.
| Period | Horizon | What traders use it for |
|---|---|---|
| 20 | Short term | Short-term trend and pullbacks; on a daily forex chart, roughly a month of trading days |
| 50 | Medium term | Medium-term trend direction; a common pullback area in steady trends |
| 100 | Medium to long term | Deeper pullbacks; a middle ground between the 50 and the 200 |
| 200 | Long term | The broad trend on the daily chart; many traders split markets into above or below it |
A period counts candles, not calendar days. Twenty daily candles cover about four weeks of forex, which trades five days a week, but under three weeks of crypto, which trades every day.
Using moving averages as a trend filter
The simplest use of a moving average is to decide which side of the market you favor.
- Position: price holding above an average suggests buyers have controlled that window; holding below suggests sellers have.
- Slope: a rising average supports an uptrend, a falling one a downtrend, and a flat one says there is no clear trend.
Slope matters more than position. Price can poke above a falling 200-period average without the trend having changed at all.
Many traders use the daily 200-period average as a filter: they look only for buying setups while price is above a rising 200, and only for selling setups below a falling 200. The filter does not tell you when to enter; it tells you which setups to ignore. To see how this fits with swing highs and lows, read trends, trendlines and market structure.
Moving averages as dynamic support and resistance
Support is a price area where falling prices have tended to stop, and resistance is where rising prices have tended to stall. Horizontal support and resistance levels stay fixed. A moving average travels with price, so traders call it dynamic support or resistance.
In a steady uptrend, price often pulls back to the 20 or 50-period average, meets buyers and turns up again. In a downtrend, rallies often stall near the same averages. Fast trends tend to respect shorter averages; slower trends, the 50 or 100.
Treat the average as a zone, not an exact line, because price often pierces it before turning. The zone carries more weight when it lines up with something else. For example, if gold is in an uptrend with the 4-hour 50 EMA near $2,400 and an old resistance level, now acting as support, at $2,395, the $2,395 to $2,405 area is where two reasons meet.
Crossovers: golden cross, death cross and lag
A crossover happens when a shorter average crosses a longer one. Crossing above suggests momentum has turned up; crossing below suggests it has turned down. The best-known pair uses the 50 and 200-period averages on the daily chart:
- Golden cross: the 50 crosses above the 200.
- Death cross: the 50 crosses below the 200.
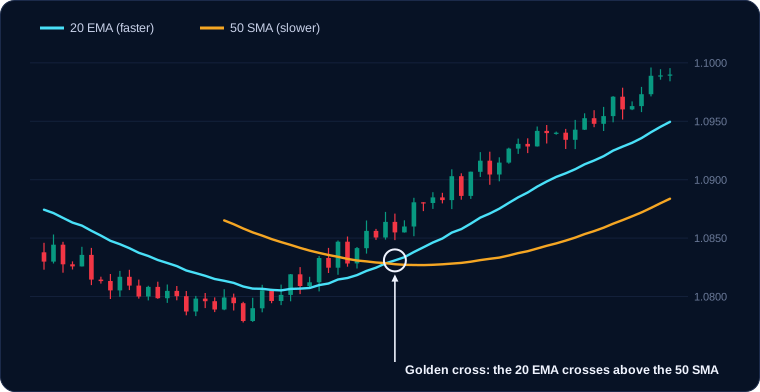
The catch is lag. Averages are built from past prices, so every crossover arrives after the move has started, and longer periods mean a bigger delay. Suppose, for example, BTC/USD bottoms at $65,000 and rallies. By the time the daily 50 crosses above the 200, price might already be at $80,000. The cross confirmed the new trend, but $15,000 of the move, about 23% from the low ($15,000 ÷ $65,000), had already happened. If the market then turns, the death cross can arrive well after the top.
Faster pairs, such as the 9 and 21-period EMAs, cut the lag but produce more false crossovers. No setting is both fast and reliable; you are always choosing between speed and noise. Many traders treat crossovers as a change in the background trend rather than an entry trigger.
Using moving averages on different timeframes
A 200-period average on a 1-hour chart covers 200 hours, roughly eight days of round-the-clock trading; on the daily chart it covers 200 sessions. To translate, multiply by the ratio between timeframes: a 50-period average on the 4-hour chart spans 50 × 4 = 200 hours, roughly the same window as a 200-period average on the 1-hour chart.
A common way to combine timeframes:
- Use a higher timeframe, such as the daily chart with its 50 or 200-period average, to define the trend.
- Move to a lower timeframe, such as the 1-hour chart, and watch for pullbacks to a shorter average like the 20 EMA in that direction.
- Treat lower-timeframe signals against the higher-timeframe trend with extra caution, or skip them.
Where moving averages fail: ranging markets
Moving averages are trend tools. When price moves sideways, the average flattens and runs through the middle of the price action. Price crosses it again and again, crossovers flip back and forth, and each apparent signal is quickly reversed. Traders call these whipsaws.
Signs you are in a range: a flat average, price crossing it often, and short and long averages tangled together. Horizontal levels and range tools usually say more there; the guide to oscillators covers RSI, Stochastic and MACD.
Common mistakes
- Treating a crossover as an entry signal on its own. Crossovers lag and fail often in ranges. Fix: use them to read the trend, then look for a separate reason to act, such as a pullback to support.
- Expecting price to bounce exactly on the line. Fix: treat the average as a zone and wait for a reaction, such as a rejection candle, before acting.
- Ignoring the slope. Fix: check whether the average is rising, falling or flat before reading anything into price being above or below it.
- Changing periods until the chart fits. Any setting looks perfect on past data. Fix: choose a few standard periods, write them into your plan and judge them over many trades.
Key takeaways
- A moving average is the average close over N candles; the SMA weights them equally, the EMA weights recent candles more.
- The EMA reacts faster but is noisier; the SMA is smoother but slower.
- Slope tells you more than position: rising, falling or flat.
- Golden and death crosses confirm trends late; they are not timing tools.
- Moving averages work in trends and whipsaw in ranges.
Frequently asked questions
Is EMA or SMA better for trading?
Neither is better in general. The EMA suits traders who want a faster reaction, such as short-term traders watching pullbacks; the SMA suits traders who want a steadier line for the broader trend. Many use EMAs for short periods and an SMA for the 200.
What is the best moving average for day trading?
There is no single best setting. Many day traders use short EMAs, such as the 9 or 20, on 5-minute to 1-hour charts, alongside a higher-timeframe average for direction. Pick one, apply it consistently, and judge it over many trades rather than a handful.
Does the 200-day moving average work on crypto?
It is widely watched on BTC/USD and other crypto charts, which is partly why price often reacts near it. Because crypto trades seven days a week, 200 daily candles cover 200 calendar days, while on forex they cover about 40 weeks of trading. Like any average, it lags and offers no guarantee that price will respect it.