Chart patterns are recurring shapes that price traces on a chart as buyers and sellers push against each other. The ones every trader should know are double tops and bottoms, head and shoulders, triangles, flags and pennants, wedges and rectangles, and each comes with a standard way to confirm it, project a target and place a stop.
Patterns do not predict the future, and many fail. What they offer is structure: a clear line that must break, a reasonable target and a precise point where the idea is wrong. This guide assumes you can already draw support and resistance and trendlines.
Continuation vs reversal patterns
- Reversal patterns form at the end of a trend and suggest it may turn: double tops and bottoms, head and shoulders and its inverse, and many wedges.
- Continuation patterns form as a pause inside a trend and suggest it may resume: flags, pennants, most triangles and many rectangles.
These labels describe tendencies, not rules, so let the breakout direction decide. Every pattern is then handled in three steps:
- Identify the shape and its key line, the neckline or boundary that price must break.
- Confirm with a candle that closes beyond that line on your timeframe. A wick through it is not a break.
- Plan the target with the measured-move method and put the stop where the pattern would be invalidated.
The measured move takes the height of the pattern and projects it from the breakout point. It is a common guideline, not a promise; price often falls short or runs further.
A pattern is only a pattern once price closes beyond its neckline or boundary. Until then it is a possibility.
Double tops and double bottoms
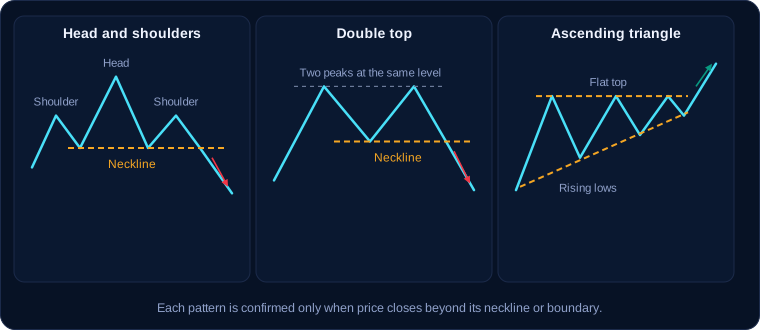
A double top looks like the letter M. Price rallies to a high, pulls back, rallies again to roughly the same high and fails. The low between the two peaks is the neckline. A double bottom is the mirror image, a W shape after a downtrend.
- Confirmation: a close below the neckline for a double top, or above the high between the two troughs for a double bottom.
- Target: the height from the peaks to the neckline, projected from the neckline.
- Stop: commonly beyond the second peak or trough.
Until the neckline breaks, two equal highs are simply resistance, and many apparent double tops turn into ranges. For example, if gold tops twice near $2,450 with a neckline at $2,400, the height is $50, so a close below $2,400 projects about $2,400 − $50 = $2,350.
Head and shoulders and inverse head and shoulders
A head and shoulders has three peaks: a left shoulder, a higher head, and a right shoulder near the level of the left one. The neckline connects the lows between them and can be flat or sloped. The inverse version has three troughs, the middle one lowest, and forms after a downtrend.
- Confirmation: a close through the neckline.
- Target: the distance from the head to the neckline, projected from the breakout point.
- Stop: commonly beyond the right shoulder.
Worked example: head and shoulders on EUR/USD
For example, EUR/USD on the 4-hour chart forms a left shoulder at 1.0920, a head at 1.0980 and a right shoulder at 1.0925, with a flat neckline at 1.0850.
- Pattern height: 1.0980 − 1.0850 = 0.0130, or 130 pips (a pip is 0.0001 on EUR/USD).
- A 4-hour candle closes at 1.0845, below the neckline. That is the confirmation.
- Measured-move target: 1.0850 − 0.0130 = 1.0720.
- Stop above the right shoulder with a 10-pip buffer: 1.0925 + 0.0010 = 1.0935.
- Risk from a 1.0845 entry: 1.0935 − 1.0845 = 90 pips.
- Potential reward to the target: 1.0845 − 1.0720 = 125 pips.
- Reward-to-risk: 125 ÷ 90 = about 1.4.
On one standard lot, where a pip on EUR/USD is worth $10, 90 pips of risk is 90 × $10 = $900. The stop distance should drive the trade size, not the other way around; see position sizing and the risk-reward ratio.
Triangles, wedges and rectangles
Triangles
A triangle forms when price swings between two converging lines and the range tightens.
- Ascending triangle: flat resistance on top and rising lows. It often breaks upward, though not always.
- Descending triangle: flat support below and falling highs. It often breaks downward.
- Symmetrical triangle: falling highs and rising lows. It often continues the prior trend, but treat both directions as possible.
Confirmation is a close outside the triangle. The target is the triangle's height at its widest part, projected from the breakout. The stop commonly goes back inside, beyond the last swing low (upside break) or swing high (downside break).
Wedges
A wedge has two converging lines sloping the same way.
- Rising wedge: both lines slope up, the lower one steeper, so each push higher gains less ground. It tends to break down, whether it forms at the top of an uptrend or as a bounce in a downtrend.
- Falling wedge: both lines slope down, the upper one steeper. It tends to break up.
Confirmation is a close outside the wedge, against its slope. Common targets are the wedge's widest height projected from the breakout, or a return to where the wedge began. The stop goes beyond the last swing inside the pattern.
Rectangles and ranges
A rectangle is a sideways range between flat support and flat resistance, with at least two touches on each side. Confirmation is a close outside the range, the target is the range height projected from the broken boundary, and the stop goes back inside, commonly beyond the midpoint or the opposite boundary.
Flags and pennants
Both start with a sharp, almost straight move called the flagpole, followed by a brief pause. A flag is a small channel sloping against the trend; a pennant is a small symmetrical triangle. Confirmation is a close beyond the pause in the flagpole's direction, the target is the flagpole length projected from the breakout, and the stop goes beyond the opposite side of the flag or pennant.
For example, BTC/USD rallies from $80,000 to $85,000, a $5,000 flagpole, then drifts lower in a tight channel to $83,500. A close above the channel at $84,200 projects $84,200 + $5,000 = $89,200, with a stop below the flag low at, say, $83,300. That is $84,200 − $83,300 = $900 of risk for $5,000 of potential reward on paper, but a large ratio says nothing about how often the target is reached.
Flags should be short: if the pause retraces more than about half the flagpole, many traders stop treating it as a flag.
Chart patterns summary table
Every pattern below is confirmed the same way: a candle close beyond its neckline or boundary.
| Pattern | Usual type | Common target | Typical stop |
|---|---|---|---|
| Double top or bottom | Reversal | Peak-to-neckline height | Beyond the second peak or trough |
| Head and shoulders, and inverse | Reversal | Head-to-neckline height | Beyond the right shoulder |
| Ascending or descending triangle | Often continuation | Widest height | Back inside, beyond the last swing |
| Symmetrical triangle | Either direction | Widest height | Back inside, beyond the last swing |
| Rising or falling wedge | Reversal or continuation | Widest height, or the wedge start | Beyond the last swing inside |
| Rectangle | Either direction | Range height | Back inside the range |
| Flag or pennant | Continuation | Flagpole length | Beyond the opposite side |
Confirmation, retests and false breakouts
A false breakout, or fakeout, happens when price pushes beyond a pattern's line and then quickly returns inside. You cannot eliminate fakeouts, but you can reduce how often they catch you:
- Wait for the close. Judge the break on your timeframe's candle close, not on a spike in the middle of the candle.
- Watch for the retest. After a break, price often returns to test the broken line from the other side. Waiting for a retest that holds filters some fakeouts, at the cost of missing moves that never come back.
- Check the bigger picture. A bearish pattern on a 15-minute chart inside a strong daily uptrend is a weaker case than one that agrees with the larger trend.
- Use volume where it means something. Where reliable volume data exists, a breakout on rising volume is usually seen as more convincing. Spot forex has no central volume figure, so forex traders lean more on the close and the retest.
- Respect a failed pattern. If price breaks out and then closes back inside, the pattern has failed; a stop placed where the pattern is invalidated limits the damage.
Common mistakes
- Seeing patterns everywhere. Fix: a valid pattern should be obvious at a glance, built from clear swing highs and lows.
- Entering before confirmation. Fix: wait for a candle to close beyond the neckline or boundary.
- Treating the measured move as certain. Fix: check for major support or resistance before the target and plan what you will do if price stalls there.
- Placing the stop to fit a position size. Fix: put the stop where the pattern is invalidated, then size the position so the possible loss stays within your plan.
Key takeaways
- Reversal patterns suggest a trend may turn; continuation patterns suggest a pause before it resumes.
- A pattern is confirmed only when a candle closes beyond its neckline or boundary.
- The measured move projects the pattern's height from the breakout; it is a guideline, not a forecast.
- Stops go where the pattern is invalidated, and position size follows from the stop.
- False breakouts are common; closes, retests and the higher-timeframe trend help filter them.
Frequently asked questions
What is the most reliable chart pattern?
No pattern is reliable on its own. Head and shoulders and double tops and bottoms are among the most widely followed, which is partly why price often reacts at their necklines. Any pattern carries more weight when it agrees with the higher-timeframe trend and is confirmed by a close.
How do you confirm a chart pattern breakout?
Wait for a candle on your trading timeframe to close beyond the neckline or boundary, not just trade through it. Some traders also wait for a retest of the broken line that holds. Each extra filter reduces fakeouts but makes entries later.
Do chart patterns work on crypto and forex?
The same shapes appear on BTC/USD, EUR/USD, gold and most liquid markets, on every timeframe. The logic of confirmation, targets and stops stays the same.