A candlestick chart shows four prices for each period: where price opened, the highest and lowest prices it reached, and where it closed. Each candle has a thick body between the open and the close and thin wicks that mark the high and the low, so one glance tells you whether buyers or sellers controlled that period.
Reading candles well means asking what each candle says about buyers and sellers, and where on the chart it formed. This guide covers anatomy, timeframes, the key patterns and common misreadings.
The anatomy of a candlestick
Every candle is built from four prices, often shortened to OHLC:
- Open: the first price of the period.
- High: the highest price reached.
- Low: the lowest price reached.
- Close: the last price of the period.
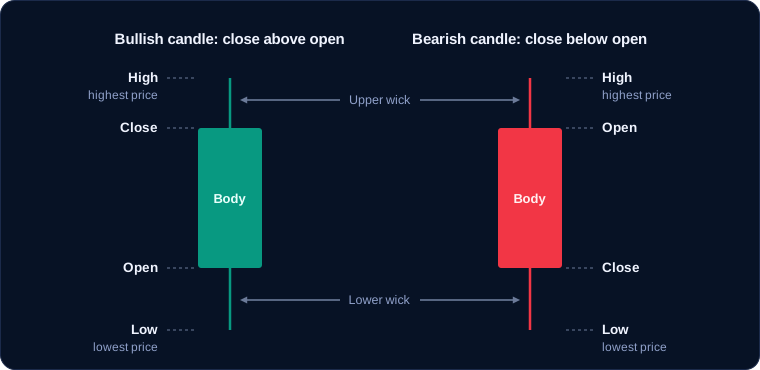
The body is the rectangle between the open and the close. The wicks, also called shadows, are the thin lines that run from the body up to the high and down to the low. The body shows the net result of the period; the wicks show how far price traveled before it was pushed back.
Bullish vs bearish candles
A bullish candle closes above its open, so its open is at the bottom of the body and its close at the top. A bearish candle closes below its open, so the order is reversed. Most platforms color bullish candles green and bearish candles red, but colors are a chart setting, so check yours.
Worked example: measuring one candle
For example, suppose a 1-hour EUR/USD candle opens at 1.0850, reaches a high of 1.0885 and a low of 1.0835, and closes at 1.0872. It closed above its open, so it is bullish. On EUR/USD a pip is 0.0001, so:
- Body: 1.0872 − 1.0850 = 0.0022, or 22 pips.
- Upper wick: 1.0885 − 1.0872 = 13 pips.
- Lower wick: 1.0850 − 1.0835 = 15 pips.
- Full range: 1.0885 − 1.0835 = 50 pips, which equals 22 + 13 + 15.
The body is less than half the range. Buyers won the hour, but not decisively: sellers pushed price 15 pips below the open, and buyers could not hold the high.
Note that most platforms, MT5 included, draw candles from the bid price, while buy orders fill at the slightly higher ask. The bid-ask spread guide explains that gap.
Timeframes: candles inside candles
A candle can represent any period: one minute (M1), 15 minutes (M15), one hour (H1), four hours (H4), one day (D1) or one week (W1). A higher-timeframe candle summarizes the candles inside it.
A 1-hour candle contains four 15-minute candles. It takes the open of the first, the close of the last, and the highest high and lowest low of all four.
For example, here are four 15-minute gold (XAU/USD) candles from 10:00 to 11:00:
| Candle | Open | High | Low | Close |
|---|---|---|---|---|
| 10:00 | 4,150 | 4,156 | 4,147 | 4,154 |
| 10:15 | 4,154 | 4,159 | 4,151 | 4,152 |
| 10:30 | 4,152 | 4,153 | 4,142 | 4,145 |
| 10:45 | 4,145 | 4,151 | 4,144 | 4,149 |
The 1-hour candle is open 4,150, high 4,159, low 4,142, close 4,149: a $1 bearish body inside a $17 range, with a $9 upper wick and a $7 lower wick. On the hourly chart it looks almost flat. Inside it, price rallied $9, fell $17 from top to bottom, and recovered $7. The higher timeframe hides detail; the lower one shows it, along with more noise.
Single-candle patterns
Doji
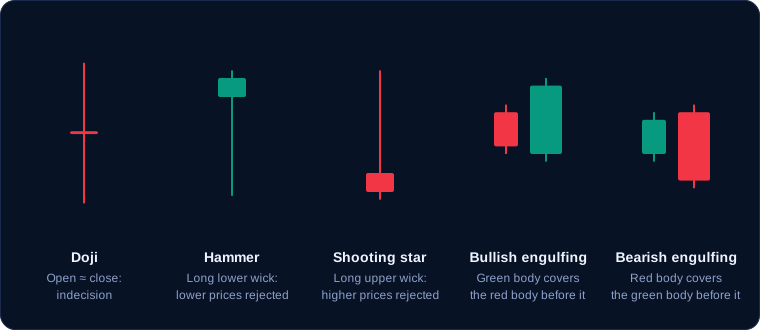
A doji opens and closes at, or very near, the same price, so its body is a thin line. It shows indecision. After a long run, a doji can hint that momentum is fading; in a quiet, sideways market it means very little.
Hammer and hanging man
Both have a small body near the top of the range, a long lower wick (commonly at least twice the body) and little or no upper wick. The name depends on what came before:
- A hammer appears after a decline. Sellers drove price down, but buyers pushed it back to close near the high: a possible bullish reversal sign.
- A hanging man is the same shape after an advance. Sellers managed a sharp push down during the period: a possible bearish sign that needs confirmation.
For example, a EUR/USD candle that opens at 1.0812, drops to 1.0780, reaches 1.0818 and closes at 1.0816 has a 4-pip body, a 32-pip lower wick and a 2-pip upper wick. After a decline, that is a hammer.
Shooting star and inverted hammer
These are the upside-down versions: a small body near the bottom of the range and a long upper wick.
- A shooting star appears after an advance. Buyers pushed price up, but sellers drove it back down: a possible bearish reversal sign.
- An inverted hammer has the same shape after a decline. Buyers showed strength but could not hold it, so it needs a bullish follow-up candle.
Marubozu
A marubozu has a full body and no wicks, or almost none. A bullish marubozu opens at the low and closes at the high, so buyers controlled the whole period; a bearish marubozu is the reverse. It signals strong momentum, often at the start of a move or on a breakout.
Two- and three-candle patterns
Bullish and bearish engulfing
A bullish engulfing pattern forms after a decline: a bearish candle is followed by a bullish candle whose body fully covers the first body. A bearish engulfing pattern is the mirror image after an advance. Compare bodies, not wicks.
Inside bar
An inside bar is a candle whose high and low both sit within the previous candle's range. That previous candle is often called the mother bar. The inside bar shows a pause, and traders watch for a break of the mother bar's high or low.
Morning star and evening star
A morning star forms after a decline:
- A long bearish candle.
- A small-bodied candle, sometimes a doji, as selling stalls.
- A long bullish candle that closes above the midpoint of the first candle's body.
An evening star is the reverse after an advance. Textbook versions show gaps between the candles; in forex, where each candle usually opens at the previous close, the pattern is read without them.
Context matters more than the pattern
A candlestick pattern tells you what happened. Its location tells you whether it matters.
A hammer at a well-tested support zone after a clear decline shows buyers defending a known level. The same hammer in the middle of a sideways range is just a candle with a long wick.
Before you give a pattern any weight, ask three questions:
- Where is it? At support, resistance, a round number or a trendline, or nowhere in particular?
- What came before it? A reversal pattern needs a move to reverse.
- What is the larger trend? A pattern that agrees with the higher-timeframe trend is generally more useful than one that fights it.
Many traders also wait for confirmation, such as the next candle closing above a hammer's high.
Candlestick patterns at a glance
| Pattern | Candles | Shape | What it may suggest |
|---|---|---|---|
| Doji | 1 | Open and close almost equal | Indecision |
| Hammer | 1 | Long lower wick, after a decline | Bullish reversal |
| Hanging man | 1 | Hammer shape after an advance | Bearish reversal |
| Shooting star | 1 | Long upper wick, after an advance | Bearish reversal |
| Inverted hammer | 1 | Shooting star shape after a decline | Weak bullish reversal |
| Marubozu | 1 | Full body, no wicks | Strong momentum |
| Engulfing | 2 | Second body covers the first | Reversal toward the second candle |
| Inside bar | 2 | Range inside the prior range | Pause before a breakout |
| Morning star | 3 | Bearish, small, bullish | Bullish reversal |
| Evening star | 3 | Bullish, small, bearish | Bearish reversal |
For patterns built from many candles, such as double tops and triangles, see chart patterns.
Common mistakes
- Reading a candle before it closes. A hammer at minute 40 can finish as a bearish marubozu at minute 60. Wait for the close.
- Ignoring the move before the pattern. The same shape can be a hammer or a hanging man. Check the prior move first.
- Trading patterns in the middle of nowhere. Give weight to patterns at support, resistance or trendlines, and skip the rest.
- Treating a pattern as a promise. Any pattern can fail. Decide in advance where the idea is wrong and place your stop loss beyond it.
- Mixing timeframes carelessly. A 5-minute bearish engulfing pattern may be a small wick on the daily chart. Check the larger timeframe.
Key takeaways
- Each candle shows open, high, low and close. The body shows the net result; the wicks show rejected prices.
- A higher-timeframe candle summarizes the lower-timeframe candles inside it.
- Shape plus the prior move defines a pattern: a hammer and a hanging man look identical.
- Location decides whether a pattern matters, especially at support, resistance or a trendline.
- Wait for the close, and treat every pattern as a clue rather than a signal.
Frequently asked questions
What is the most reliable candlestick pattern?
No pattern is reliable on its own. Engulfing patterns and long-wicked hammers or shooting stars are widely watched, but their usefulness depends on location and trend. A modest pattern at a strong level usually tells you more than a perfect one mid-range.
What timeframe is best for reading candlesticks?
Candles work the same way on every timeframe, but higher timeframes carry less noise, so 4-hour and daily patterns tend to be cleaner than 1-minute ones. Many traders read direction on a higher timeframe and time entries on a lower one.
What does a long wick on a candle mean?
A long wick shows prices that were reached and then rejected within the period. A long lower wick means sellers pushed price down but buyers pushed it back up; a long upper wick means the opposite. At key levels, long wicks often say more than the body.
Do candlestick patterns work on crypto and gold?
Yes. Candlesticks describe price action, so they apply to any market with open, high, low and close data. Crypto trades every day, while forex and gold charts can open with a gap after the weekend.