The RSI (Relative Strength Index) is a momentum oscillator that compares the size of recent gains with the size of recent losses and expresses the result on a scale from 0 to 100. With the standard 14-period setting, readings above 70 are called overbought and below 30 oversold, but those labels describe momentum, not a promise that price will turn.
Wilder's RSI is one of the most widely used indicators because it answers a simple question: have the up moves or the down moves been winning lately, and by how much? If oscillators are new to you, start with oscillators explained.
How RSI is calculated: Wilder's method
- For each candle, measure the change from the previous close.
- Record a gain when the close is higher and a loss, as a positive number, when it is lower. An up candle counts as zero loss and a down candle as zero gain.
- Average the first 14 gains and the first 14 losses: add each set up and divide by 14.
- From then on, smooth each average:
new average = (previous average × 13 + current value) ÷ 14. - Divide the average gain by the average loss to get RS, the relative strength.
- Convert RS to the 0 to 100 scale.
RSI = 100 − 100 ÷ (1 + RS)
The smoothing in step 4 gives RSI a memory: each new candle moves it only part of the way. If there are no losses at all over the period, RSI reads 100. Platforms can calculate the averages slightly differently, so readings may differ by a point or so.
Worked example: calculating RSI on EUR/USD
For example, over the last 14 hourly candles on EUR/USD, the gains add up to 84 pips and the losses to 56 pips (a pip is 0.0001).
- Average gain: 84 ÷ 14 = 6 pips. Average loss: 56 ÷ 14 = 4 pips.
- RS = 6 ÷ 4 = 1.5.
- RSI = 100 − 100 ÷ 2.5 = 100 − 40 = 60.
The next candle closes 12 pips higher:
- Average gain: (6 × 13 + 12) ÷ 14 = 90 ÷ 14 = 6.43.
- Average loss: (4 × 13 + 0) ÷ 14 = 52 ÷ 14 = 3.71.
- RS = 6.43 ÷ 3.71 = 1.73, so RSI = 100 − 100 ÷ 2.73 = 100 − 36.6 = 63.4.
Then a candle closes 20 pips lower:
- Average gain: (6.43 × 13 + 0) ÷ 14 = 83.59 ÷ 14 = 5.97.
- Average loss: (3.71 × 13 + 20) ÷ 14 = 68.23 ÷ 14 = 4.87.
- RS = 5.97 ÷ 4.87 = 1.23, so RSI = 100 − 100 ÷ 2.23 = 100 − 44.8 = 55.2.
One 20-pip drop pulled RSI down about 8 points, more than twice as far as the 12-pip gain lifted it. RSI responds to the size of each move relative to the recent averages, not just its direction.
Reading RSI levels: 70, 30 and 50
- Above 70 (overbought): gains have strongly outweighed losses. In a range, near resistance, it can warn that a rally is stretched. In a strong uptrend, it often just confirms strength.
- Below 30 (oversold): losses have strongly outweighed gains. The same caution applies in a strong downtrend.
- 50 (the midline): average gains equal average losses (RS = 1). Many traders read RSI holding above 50 as bullish momentum and below 50 as bearish, a simple trend filter.
RSI ranges shift in trends
In strong uptrends, RSI often holds roughly between 40 and 80: pullbacks bottom out around 40 to 50 instead of reaching 30, and rallies push into 70 to 80. In strong downtrends the range shifts down to roughly 20 to 60. So in an uptrend, a dip toward 40 may tell you more than waiting for an oversold 30 that never comes.
| RSI behavior | What it often suggests |
|---|---|
| Swings mostly between 40 and 80 | Strong upward momentum |
| Swings mostly between 20 and 60 | Strong downward momentum |
| Swings between 30 and 70 around 50 | No clear trend, range-bound conditions |
RSI divergence: regular and hidden
Divergence means price and RSI disagree. Compare swing highs with swing highs, and swing lows with swing lows.
Regular divergence
- Bearish: price makes a higher high, RSI a lower high. The rally is losing momentum and may stall or reverse.
- Bullish: price makes a lower low, RSI a higher low. Selling pressure is fading.
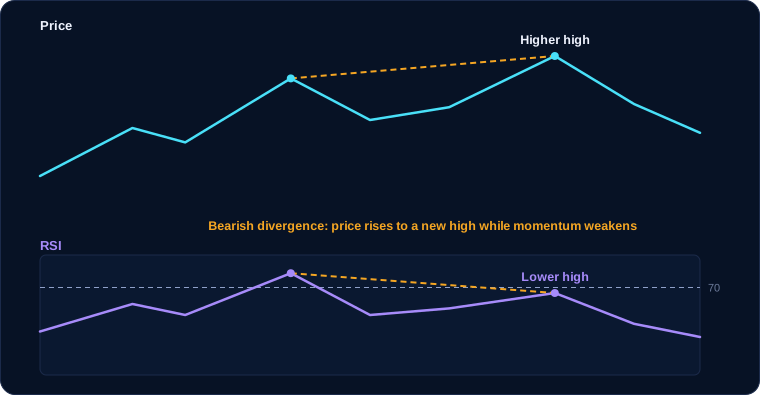
Regular divergence is a warning, not a trigger. In a strong trend it can appear several times before price turns.
Hidden divergence
Hidden divergence points the other way: it suggests the trend may continue.
- Hidden bullish: in an uptrend, price makes a higher low but RSI makes a lower low. The pullback was sharp in momentum terms, yet buyers defended a higher price.
- Hidden bearish: in a downtrend, price makes a lower high but RSI makes a higher high.
| Type | Price | RSI | What it suggests |
|---|---|---|---|
| Regular bearish | Higher high | Lower high | Uptrend losing momentum |
| Regular bullish | Lower low | Higher low | Downtrend losing momentum |
| Hidden bullish | Higher low | Lower low | Uptrend may continue |
| Hidden bearish | Lower high | Higher high | Downtrend may continue |
Failure swings
Wilder also described failure swings, which use the RSI line alone and ignore price.
- Bearish failure swing: RSI rises above 70, drops back, rallies again but fails to get back above 70, then falls below the low of its previous dip.
- Bullish failure swing: RSI falls below 30, bounces, dips again but holds above 30, then rises above the high of its previous bounce.
That previous dip low or bounce high is the failure point, and breaking it completes the pattern. It shows that momentum tried to reach an extreme again and could not.
RSI settings by trading style
The period controls sensitivity. A shorter period reacts faster, reaches 70 and 30 more often and produces more signals, along with more noise. A longer period is smoother and gives fewer, later signals.
| Style | Common periods | Levels often used | Trade-off |
|---|---|---|---|
| Scalping and fast intraday | 5 to 9 | 80 and 20 | Many signals, much more noise |
| Day and swing trading | 14 (default) | 70 and 30 | Balanced, the most widely watched |
| Longer-term swing and position | 21 to 25 | 70 and 30, or 60 and 40 | Smoother, fewer and later signals |
Wider levels suit short settings and narrower levels suit long ones. Treat all of these as starting points to test.
Worked example: reading RSI on gold
For example, gold is in an uptrend on the 4-hour chart, with RSI 14 below the price.
- Gold rallies to $2,450 and RSI reaches 76.
- Price pulls back to $2,410 and RSI dips to 48.
- Gold pushes to a new high at $2,470, $20 above the last one, but RSI peaks at only 66. That is regular bearish divergence.
- RSI went above 70, dipped to 48 and failed to get back above 70. If it now drops below 48, it completes a bearish failure swing.
- On the price chart, the key line is the $2,410 swing low. A 4-hour close below it would be a lower low, confirming the divergence with structure.
A trader planning around that break would also have to define risk. With an entry near $2,405 and a stop above the high at $2,475, the distance is $2,475 − $2,405 = $70. If one lot is 100 troy ounces, a $1 move is worth $100 per lot, so $70 is $7,000 per lot, or $700 on 0.10 lots. Contract sizes vary, so check the specification on your own platform and size from the stop; see position sizing.
Had RSI pushed back above 70 with the new high instead, there would be no divergence and no failure swing, and the uptrend's momentum would look intact.
Common mistakes
- Selling every reading above 70, or buying every reading below 30. Fix: identify the trend first; in an uptrend, watch dips toward 40 to 50 rather than betting against strength.
- Acting on divergence before price confirms. Fix: wait for a break of a swing point or trendline.
- Drawing divergence between random points. Fix: compare consecutive, clearly visible swing highs or lows, and line up RSI with the same candles.
- Changing the period after every loss. Fix: choose a setting for your style, write it into your plan and judge it over many trades.
- Using RSI in isolation. Fix: combine it with the trend and a key level such as support and resistance.
Key takeaways
- RSI compares average gains with average losses over 14 periods using Wilder's smoothing, then scales the result from 0 to 100.
- 70 and 30 mark strong momentum, not automatic reversals; 50 works as a simple trend filter.
- In strong trends the RSI range shifts, often to 40 to 80 in uptrends and 20 to 60 in downtrends.
- Regular divergence warns that a trend may be tiring; hidden divergence suggests it may continue.
- Shorter settings give more signals and more noise; longer settings give fewer, later signals.
Frequently asked questions
What is the best RSI setting?
The default 14 is the most widely used and a sensible starting point. Shorter settings such as 7 or 9 suit traders who want faster signals and accept more noise; longer settings such as 21 suit slower styles. Whatever you choose, test it on your market and keep it consistent.
What does an RSI of 50 mean?
At 50, average gains and average losses over the period are equal, so neither side has the upper hand. Many traders read RSI holding above 50 as bullish momentum and below 50 as bearish momentum.
Can RSI stay overbought for a long time?
Yes. In a strong uptrend RSI can stay above 70 for many candles while price keeps rising. That is why an overbought reading on its own is not a reason to sell; it mainly shows strong momentum.
Is RSI divergence reliable?
Divergence shows that momentum is changing, but it often appears several times before a trend turns, and sometimes the trend continues anyway. It works better as a warning than as an entry signal, and it is best confirmed by price structure.